Hosting a webinar great for creating brand awareness, building community, and driving business growth. Wondering if your webinar is really hitting the mark? That's where webinar analytics come in. They help you understand what works, what doesn’t, and where there’s room for improvement.
We get it – delving into data can be a bit overwhelming, even for seasoned marketers. We're here to simplify it for you. In this article, we’ll break down the essentials of webinar analytics in a way that's easy, practical, and directly applicable to your next webinar. We're not just talking about numbers and charts. We’ll share real insights that can turn your webinars into powerful tools for engagement and conversion.
Why Webinar Analytics Matter
Webinar analytics give concrete data on what you are doing right and where you need to improve. Without this data, your webinar strategy may wander without a clear direction.
For example, by studying critical data such as watch time, engagement levels, and feedback, you can learn exactly what topics resonate with your audience or how long they want the presentations to be.
The great thing about webinar analytics is that you get the data immediately after each webinar, rather than waiting till the end of the month or quarter. You can use that data to start a cycle of continuous improvement right away.
Over time, the webinar data you accumulate will help you review your overall performance and design an airtight strategy for future online events.
Advantages Gained from Webinar Analytics
Digging into your webinar analytics helps you improve in the future. Let's dive into the specific benefits of analyzing webinar data:
1. Informed decision-making and content optimization
Webinars, with interactive features like live chat and polls, go beyond passive viewing. This viewer engagement is a goldmine for data-driven decisions. Use it to identify and enhance the most engaging parts of your webinar for future events.
This iterative process of content refinement, informed by actionable insights, not only enhances the overall quality of your webinars but also ensures that each presentation is a dynamic and engaging experience for your audience
2. Improve webinar ROI
Webinars are already highly cost-effective as a marketing strategy, especially compared to in-person events. You don’t have to pay for a physical venue, fly in participants, or fork out for a multitude of other costs related to events. You can use webinar analytics to get an even better return on investment (ROI). By digging into the data you’ll be able to improve the conversion rate and ROI of your webinars. We’ll get into more detail on improving conversion rates later on in this article.
3. Audience segmentation
Segmenting your audience involves categorizing them based on shared characteristics. It allows you to tailor your webinar content to specific groups. By understanding the unique preferences and needs of each segment of your audience, you can create webinars that are more targeted and relevant. This practice not only enhances the overall viewer experience but also ensures that your webinars are more impactful and resonate deeply with diverse audience segments.
7 Important Webinar Metrics to Measure Success
Let's explore the critical webinar metrics that play a crucial role in assessing the effectiveness of your webinar strategy.
1. Attendance rate
This measures the percentage of registered attendees who actually showed up for your live webinar or watched it on-demand.
Calculate it as follows:
How to interpret and use this data to increase attendance rates:
- Analyze patterns over time. Do certain topics, times, or days yield higher attendance rates?
- If there is a huge gap between who registered for the webinar and who actually attended, conduct surveys or send follow-up emails to understand why most registrants did not attend.
- Take stock of the number of audience members who watch the recorded webinar later, as many people sign up to engage later at a convenient time. This also indicates the level of interest in your topic and can help in tweaking content to audience preferences.
2. Engagement level
This webinar metric primarily tracks the types and frequencies of interactions within the webinar. It involves measurable actions such as participating in polls, asking questions, or engaging in chat discussions
The focus here is on measuring the direct interactions of the audience with the content or presenters. Analyzing the engagement level can give you insight into the most engaging or interactive parts of the webinar, allowing for content optimization in future events.
3. Conversion rate
The core purpose of webinars is to attract, nurture, and convert customers through compelling content. Yet, it's important to note that not all webinars are centered around sales; some aim to expand audiences or educate existing customers, necessitating a versatile approach in strategy. Your conversion goal could be product signups, demo requests, purchases, or even something as simple as getting existing customers to try a new feature.
Conversion rate is one of the most important webinar KPIs. It measures the number of people that took your primary desired action during or after the webinar.
It can be calculated as follows:
However, remember that the conversion rates can differ across industries and types of webinars. That makes it hard to know what a “good” conversion rate is.
Strategies for improving conversion rates:
A higher conversion rate demonstrates the webinar’s ability to persuade and motivate the audience to take action. Here is what to do to improve webinar conversions:
- Motivate webinar attendees to join an online community where they can network, share insights, and discuss webinar-related topics. Strategically introduce offers, exclusive content, or incentives aligned with the group’s interests to foster trust and belonging.
- Boosting webinar conversion rates begins even before the event kicks off. Offer a glimpse of what's to come through teaser content like short videos or articles, showcasing your expertise and providing upfront value. Encourage early registration with incentives such as exclusive resources or limited-time discounts. Craft a compelling narrative around the webinar theme, addressing attendees' pain points, and emphasizing the unique value they'll gain.
- During the webinar, spark engagement by using live polls, interactive Q&A sessions, and live chat for real-time discussions. Cultivate a sense of community by encouraging participants to connect and share insights in the chat. You could also give exclusive offers or time-sensitive incentives aligned with the webinar's focus to heighten interest and prompt immediate action. Emphasize the post-webinar benefits, like ongoing access to resources and a vibrant online community.
4. Attendee engagement
There is a huge difference between people who simply show up for the webinar versus people who actively participate. Are they asking questions?
Are they taking part in poll questions and surveys? Are they connecting with others during the live chat? You must pay attention to these intent signals.
The success of a webinar hinges on the level of attendee engagement. Engagement, after all, defines their intent to take further actions, such as signing up for a free trial or buying the product or service.
So, what strategies can you apply to enhance overall attendee engagement?
- Your chosen webinar software should give you detailed analytics on specific intent signals, for instance, who participated in the polls, what types of questions were asked, how many people participated in the chat, and so on.
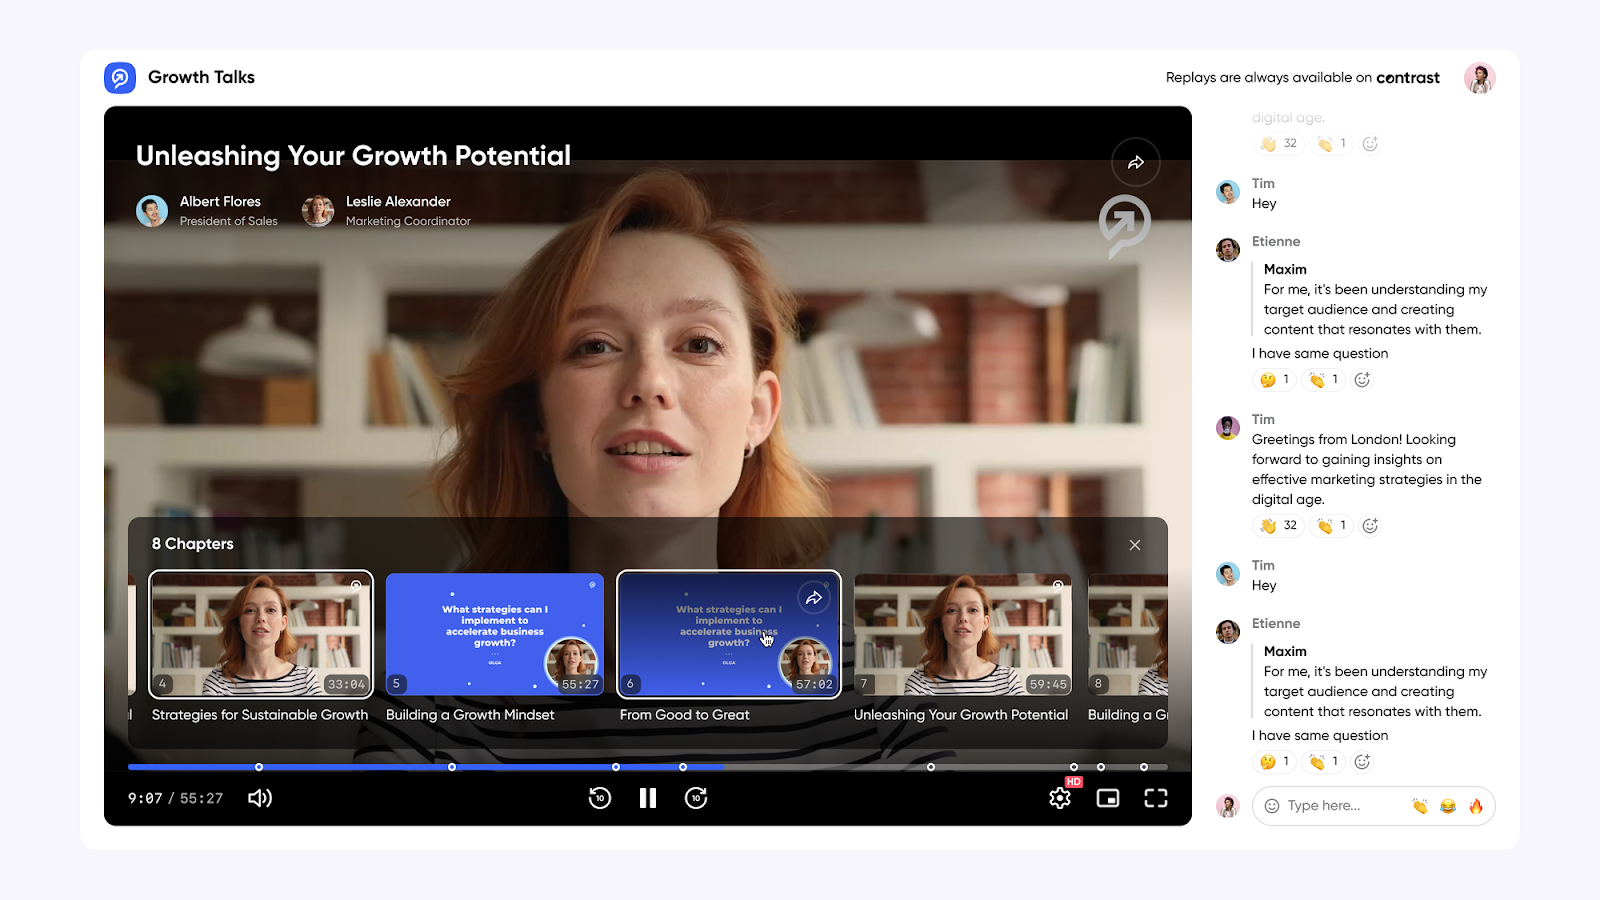
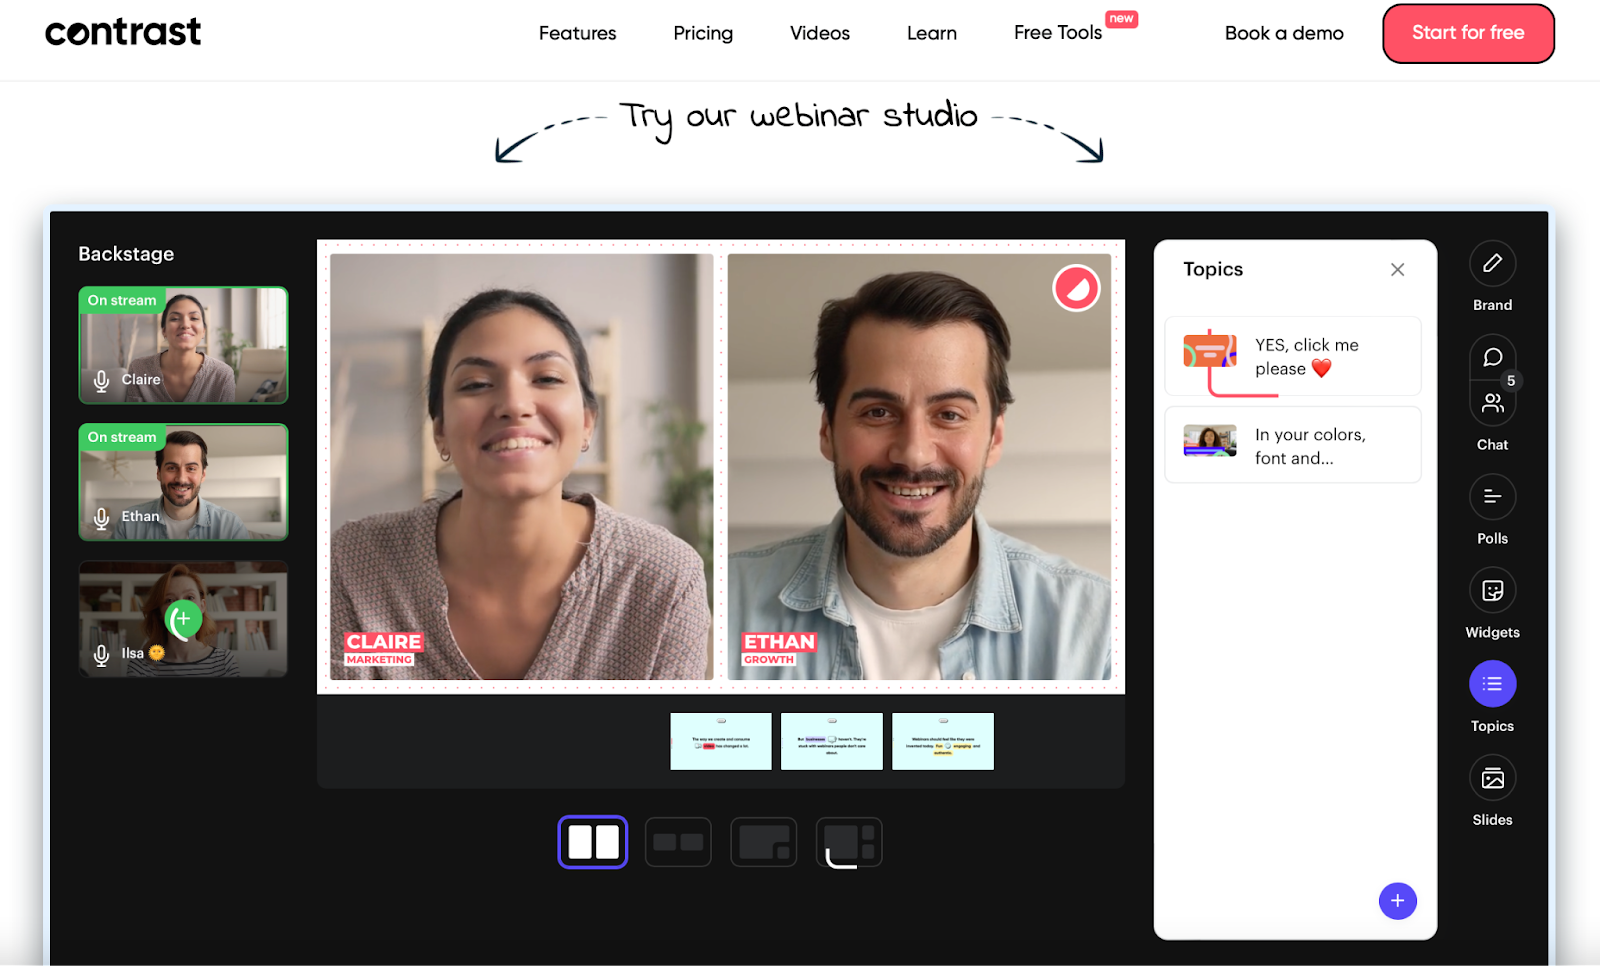
Contrast offers a free built-in Webinar Studio, making it easy to boost webinar engagement, as shown below.

- Also, include a short post-webinar survey where attendees can point out exactly what they liked and did not.
If, for instance, you see that a certain segment of your audience is especially responsive to a certain topic or discussion, you could create more non-webinar content around that topic tailored to that segment.
All of this will give you valuable data on how to tweak your content and presentation in subsequent webinars.

Try the Data-Driven Webinar Platform Built for Engagement
Start for free up to 30 registrants. No credit card needed.
Start for free5. Watch time
This measures how long your audience members stayed for the webinar. It is a critical metric, especially in this era of “Zoom fatigue,” and a good indicator of how engaging your content is. There are two ways to use watch time:
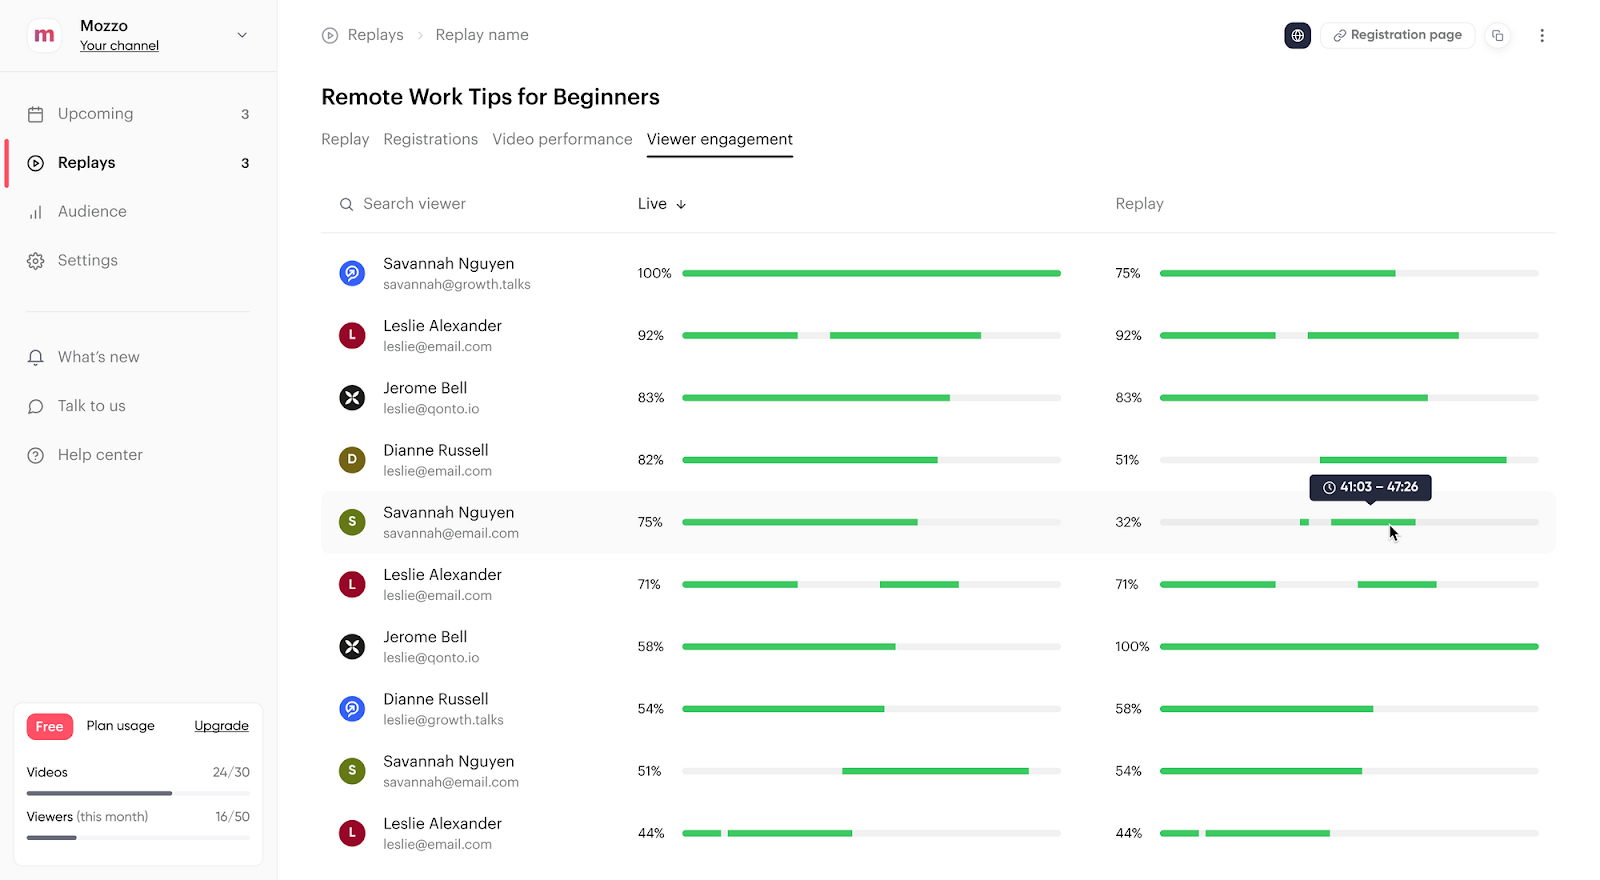
Watch time per individual - This tells you how long a specific attendee watched your webinar. If they attended the entire session, it signals interest in your content or topic, prompting you to prioritize follow-up with them. If someone watched a bit of your session and then bounced off, try re-igniting their interest by sending them a clip of the webinar they missed.
For instance, imagine a sales representative who has been targeting a specific enterprise for a while. They notice in their CRM that a lead from that company has registered for a webinar. After the webinar, they could check that the person attended the webinar and see exactly how much of it they watched. Now they can tailor a personalized follow-up email accordingly and say something like, “Hi [attendee name], I noticed you attended our webinar on [topic]. What did you think about [specific topic that was discussed during the part of the webinar they watched].”
This is how watch time per individual looks is displayed in Contrast:
Average watch time across all attendees - This tells you how your webinar content performed. A higher number indicates your topic/content was interesting or that you had a compelling speaker. If you observe a low average watch time, you might want to rethink how you format your webinars.
To optimize your watch time, we recommend keeping your audience engaged with strategies like polls and live chat. Even simple tactics like including a “hand raise” button to ask questions or an upvote button for popular questions/comments can help improve.
6. Live vs. on-demand views
Live audiences usually seek real-time interaction with the presenter and other attendees, which can enhance the sense of community and urgency. However, it requires viewers to be available at a specific time, which can limit the audience size.
A study of 100,000 registrants showed that making your webianr available on-demand can increase views by nearly 50%!
On the other hand, on-demand viewers prioritize convenience and flexibility in consuming content at their own pace. Or they only found out about the webinar later. The challenge, however, lies in less audience interaction and the potential for a less dynamic experience compared to live sessions.
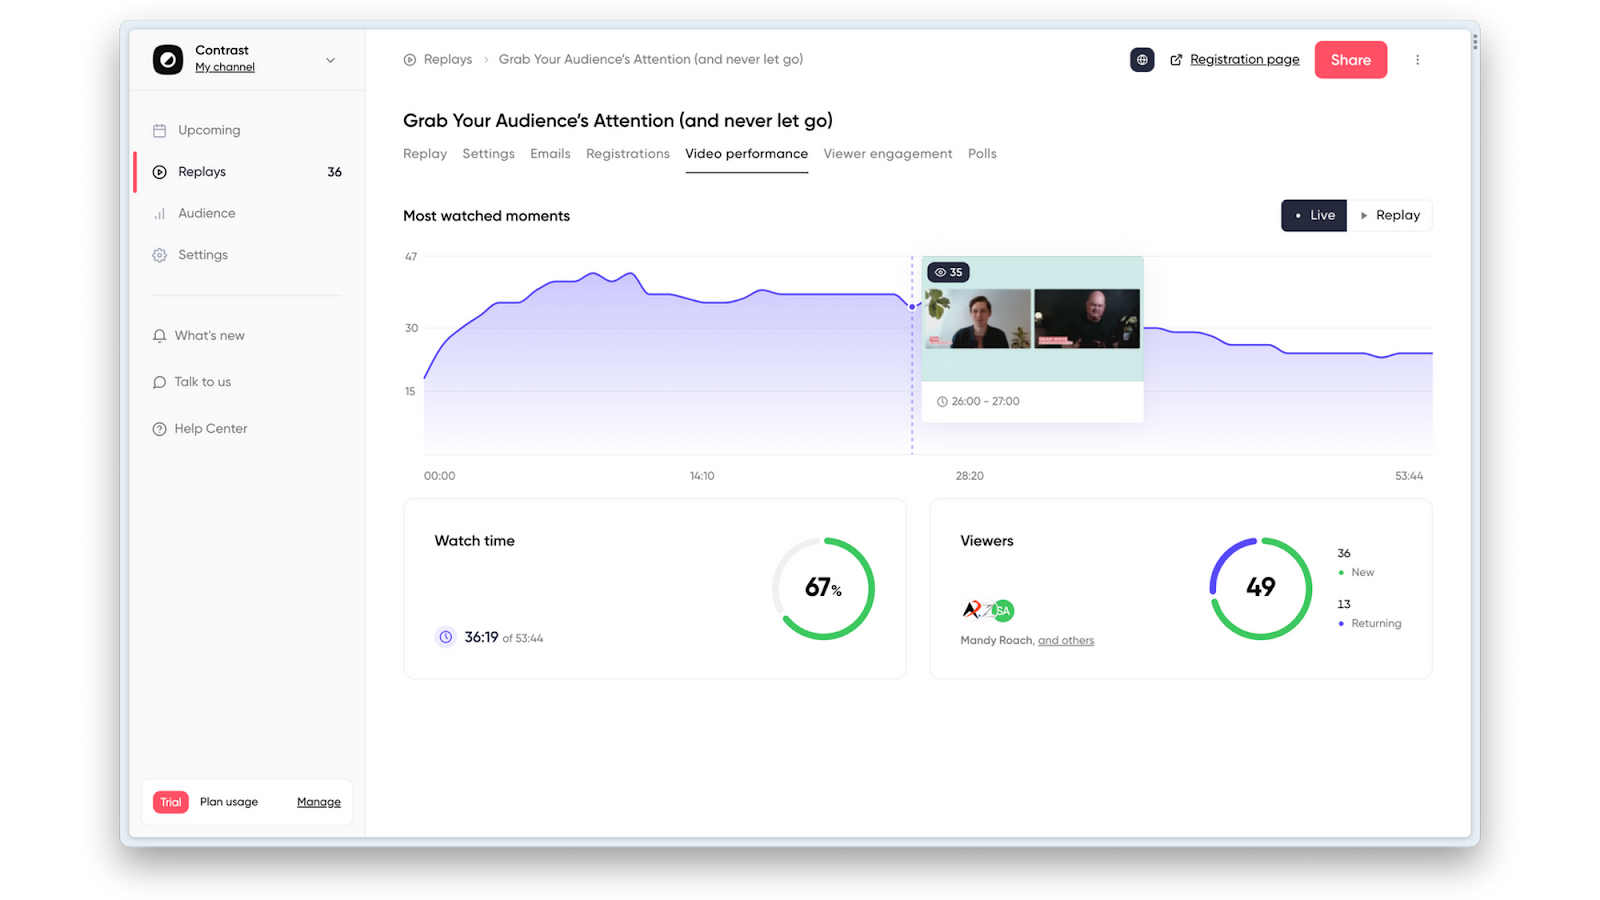
Tracking your on-demand views shows how many plays the webinar recording receives after the live event. It is a good way to measure your webinar’s long-term reach and impact. It also shows you which moments were the least and most engaging (where people skipped, what they skipped to, etc).
How to Assess Webinar Data Using Contrast
Navigating the landscape of webinar analytics is essential for honing your event strategy, and with Contrast as your platform, insightful data is at your fingertips. While other webinar platforms often reserve robust analytics for paid subscriptions, Contrast stands apart by offering a comprehensive analytics suite even on our free plan.
We recognize the intrinsic value of data in refining your webinar approach and believe that access to these insights shouldn't be a premium privilege. In this guide, we'll walk you through the steps to leverage Contrast's analytics, ensuring that every host can make informed decisions to enhance their webinar impact.
1. Create Your Free Account
Begin by creating your free Contrast account. We offer all of our webinar analytics on our free plan.
2. Navigate to the Analytics Dashboard
Click on "webinars" in Contrast’s Webinar Studio. Select the specific webinar you want to analyze, and then click "audience" to explore audience-specific analytics.
3. Check and analyze the data collected
We automatically measure everything you need to know about your webinar. This includes the total number of registrants and attendees, how they found out about your event, and how they interacted with the webinar.
4. Filter your data to refine lead nurturing
Segment your audience information based on behavior, demographics, or other criteria to gain more nuanced insights.
In Contrast, to segment your data, you can use the filter panel on the left-hand side under “audience” and filter by source, member status, verification status, attendance, and whether that was live or replay.
For recorded and rewatched webinars, you can check how on-demand viewers interact with the content differently from live attendees.
When you filter, the audience view will adjust according to your set filters. This allows you to dig deep into your data. You can also export the data as a CSV or sync it with your other tools through our integrations.
This analysis can help you identify patterns in attendee behavior, gauge the effectiveness of your content, and understand what aspects of the webinar captured the most interest.
5. Generate reports to identify trends and sales-ready leads
Get custom reports on your webinar platform, focusing on the KPIs and metrics most relevant to your objectives. If integrated with HubSpot or other CRMS, pull data to analyze how webinar attendance correlates with sales or leads.
Use built-in visualization tools to craft graphs and charts that make the data more accessible and understandable. These insights enable a more dynamic adjustment of strategies and content to improve ROI, such as optimizing webinars’ timing, content, or promotion.
6. Compare against industry/competitor numbers
To analyze effectively, you must have clear goals and benchmarks for your webinar. This could be a certain number of leads generated, a target attendee count, or a level of audience engagement (such as poll participation, questions asked, and chat activity).
By understanding where your webinar stands relative to others in your industry, you can identify areas where you excel and areas that need improvement, guiding strategic decisions to enhance future webinar performance.
Using Webinar Analytics to Plan Your Next Webinar
Your webinar's effectiveness relies heavily on the leads and engagement it garners - and to optimize that, data is key We recommend adopting an iterative approach, wherein you study the webinar analytics for each webinar and make note of insights like:
- How active people were on the polls and Q&As
- What times was engagement at its peak, and when did it drop
- Which parts of the webinar content garnered the most engagement
- Which topics resonated the most (as measured by questions/upvotes/poll responses)
It is also important to view each metric in the context of the other metrics - you might have a high attendance rate, for instance, but a low attendee engagement rate. You can then use that data to optimize the content for your next webinar.
There is scope for long-term improvement, too. By analyzing data over time, you can get big-picture insights on the webinar formats and engagement strategies that garner the most engagement and the highest conversion rates.
This is valuable data for your webinar strategy and overall webinar marketing strategy - you can now adjust your other content formats to reflect the topics and styles your audience members showed interest in.
By focusing on continuous improvement, you can start seeing more impactful results much sooner and create a stronger case for senior management to keep investing in webinars.
Get started on your next webinar with Contrast.
Contrast was built to simplify the process of hosting interactive webinars. It lets you focus on delivering high-quality content without worrying about the planning process.
The platform is also designed to help you adopt a data-driven approach to your webinar marketing strategy. We make it easy to extract valuable insights and implement changes based on data.
Top features
- Unlimited seats
- Modern chat option
- Easy-to-use interface
- 24x7 customer support
- Built-in transcript features
- Fully customizable to your brand
- Rich analytics and reporting features
- Registration pages built for conversion
- On-screen widgets, such as tickers and trending messages
- Dynamic layouts to reflect the theme of your presentation
- Powerful editing features to repurpose webinar content as you like
Pricing
Almost all of our features are available for free and you can sign up without a credit card. If you need to host larger audiences, our annual Pro plan is just €60/month. More details here: Contrast pricing
Conclusion
Every webinar metric has a story to tell. By investing in webinar analytics, you will know exactly where and how to personalize your efforts and budget to drive maximum conversions and give your audience an experience they’ll remember.
Contrast’s webinar analytics give you granular insights to improve your events. You also get many options to customize your content and engage viewers, as well as tailored recommendations after each webinar.
Try the Data-Driven Webinar Platform Built for Engagement
Start for free up to 30 registrants. No credit card needed.
Start for free